New Relic is an application performance monitoring (APM) tool for Developers and Ops, focused on providing deep insight into the project’s performance and reliability in real-time. Designed to pinpoint and diagnose issues within an application, it can track the throughput of your web transactions, analyze application exceptions, find slowness in queries or web requests, and, generally, gives a great amount of useful data for detailed troubleshooting.
Since New Relic is one of the most frequently used solutions for supervising application metrics, we have prepared a special add-on to simplify its delivery. The add-on allows you to install the New Relic monitoring agent in a single mouse click and start tracking the most crucial application server information in a matter of minutes. In addition, you can always stay up-to-date with the embedded option for automatic installation of available New Relic updates.
Let’s explore how to unveil the latent performance capacities of your application with the help of New Relic – to proceed with the add-on installation, you’ll need to have:
- A New Relic account (free accounts will work fine for most users)
- At least a single environment created within the platform
Once these conditions are fulfilled, you can easily integrate the New Relic agent to your cloud environment – just follow the steps below.
New Relic Add-On Installation
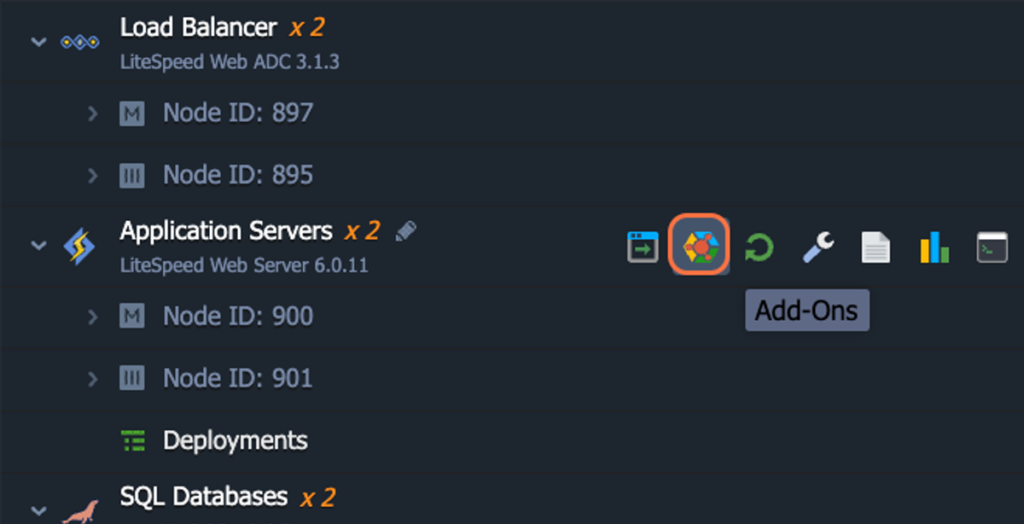
First, navigate to your application layer and choose the “Add-Ons” option:
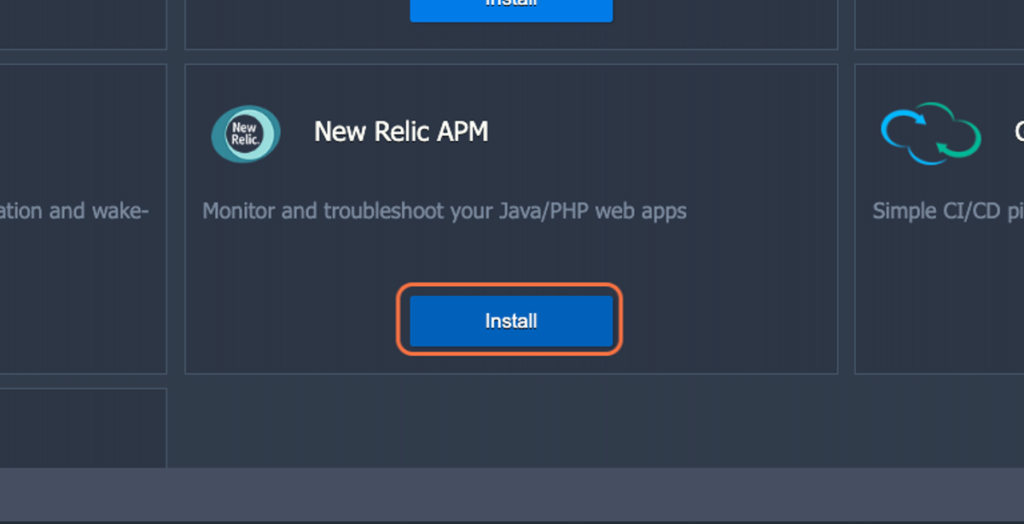
Find “New Relic APM” and choose “Install”:
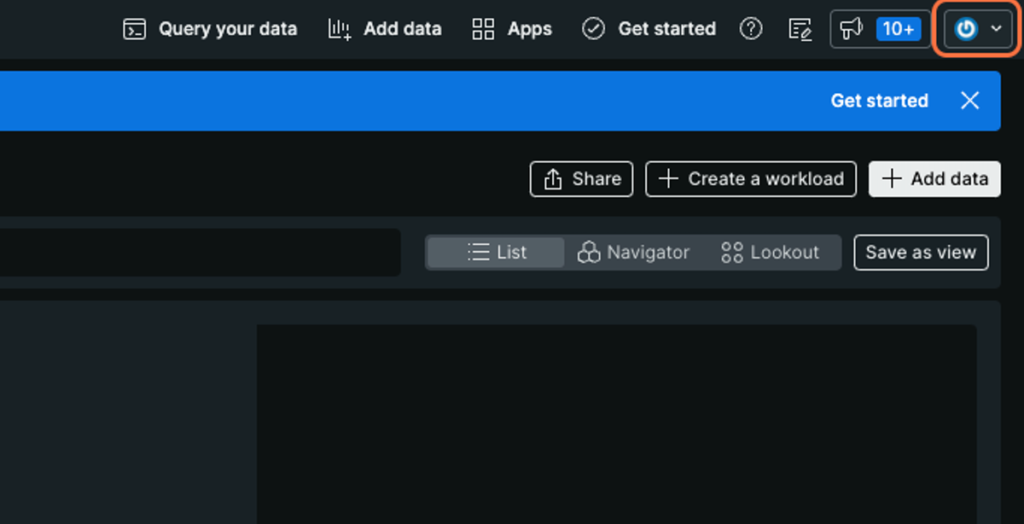
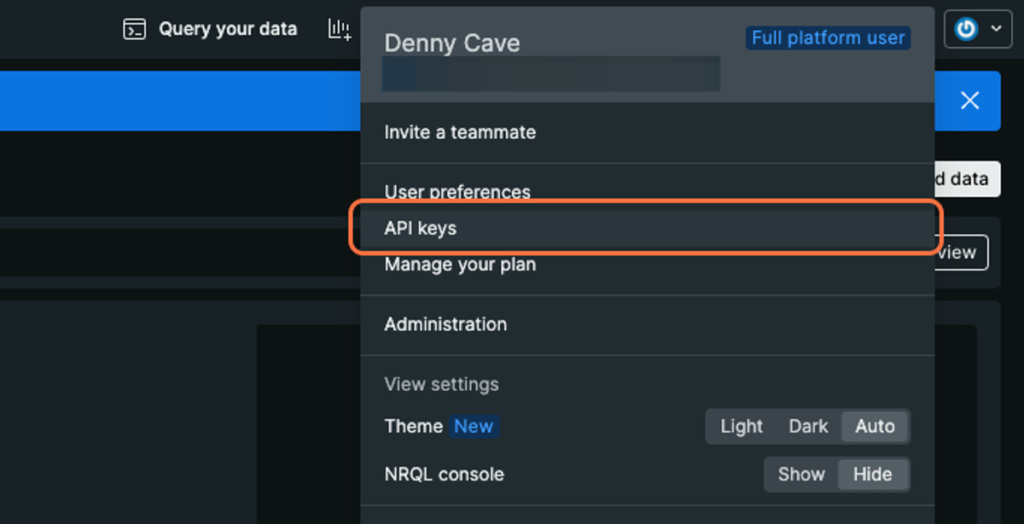
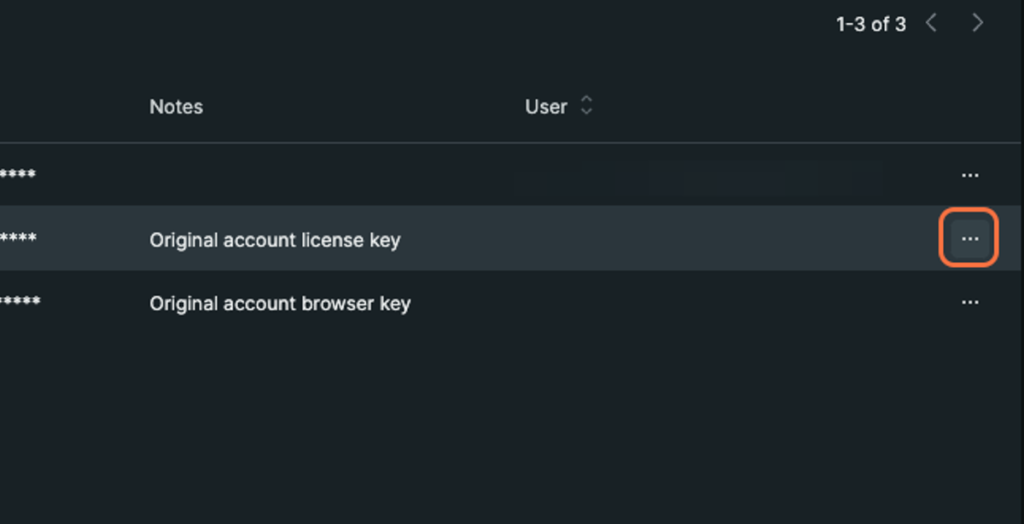
Login to your New Relic account in a separate window and obtain your “INGEST – LICENSE” API key:
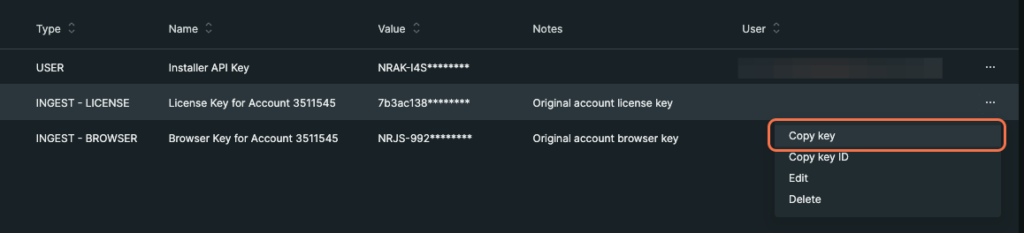
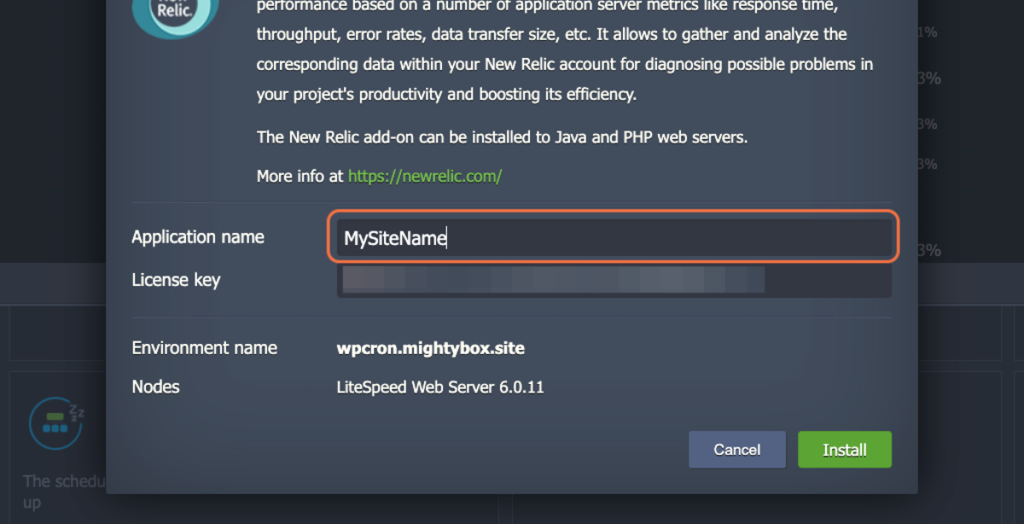
Paste the key into the New Relic installer and, optionally, set an application name by which you’d like to identify this environment within New Relic:
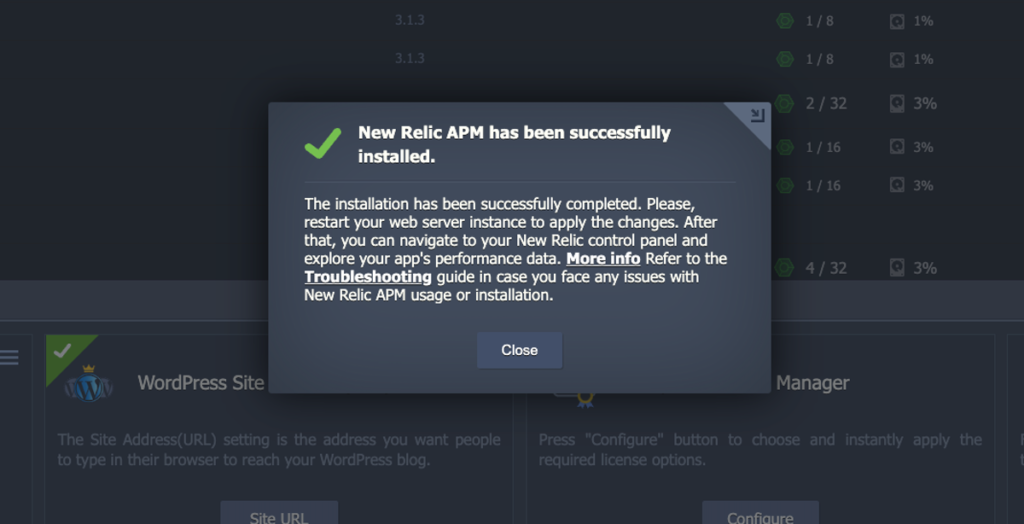
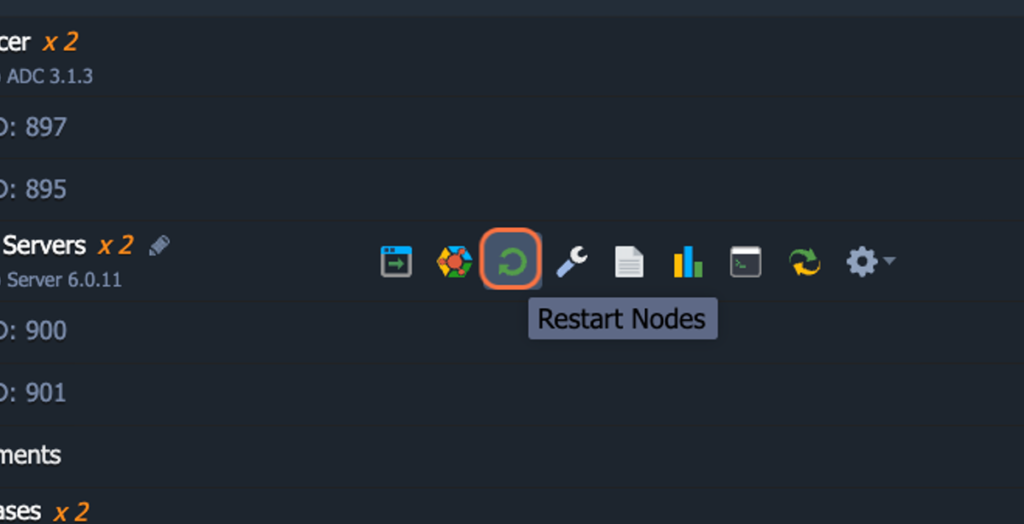
After installation, close the “success” message and restart the application nodes to complete installation:
Visit your website in the browser and navigate to several pages. This will ensure that the New Relic agent has activity to log to the system.
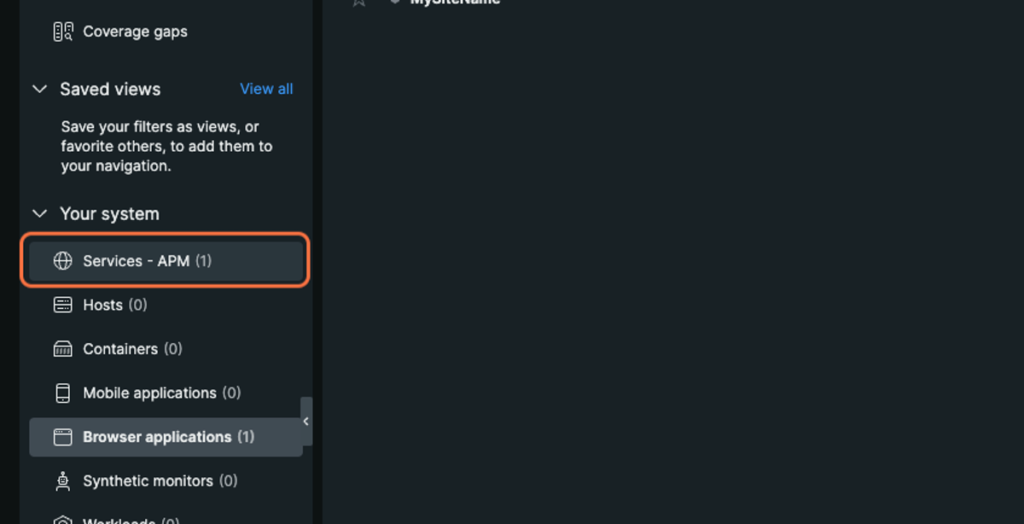
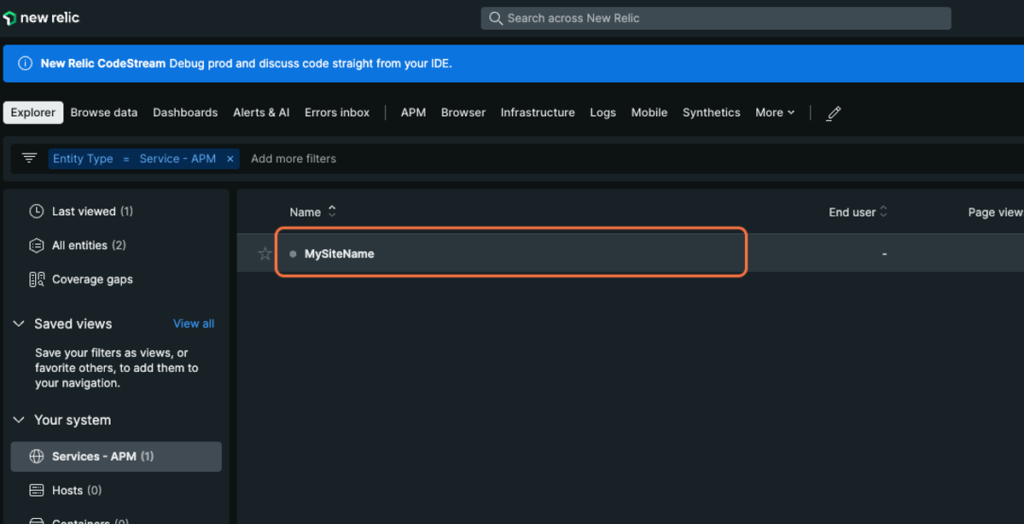
After several minutes, activity will appear within your New Relic dashboard under “Services – APM” and “Browser Applications.” Click through to either of those to access details about your newly-added site: